Wednesday, April 27, 2016

East Antarctica beginning to melt like Greenland did less than a decade ago.

This is not good news. I certainly did not expect to see photos of ice-melt runoff in that place, even in its East End, like this this so soon.

(Note: the East End, a term I'm nicking from London geography, is the side of West Antarctica that fronts the sea next to the Ross Ice Shelf; the West End of course would be next to the West Antarctic Peninsula south of South America.)

From the Robertscribbler:

Melt Expanding into East Antarctica as Nansen Ice Shelf Crack Produces 20 Kilometer Long Iceberg
Ever since 1999 a gigantic crack has been growing in the Nansen Ice Shelf in East Antarctica. By 2014, expansion of the crack accelerated. As of early 2016, the crevice had grown to 40 kilometers in length. Flooded by melt along the Ice Shelf’s warming surface and weakened by the heating of ocean waters from below, on April 7th, according to ESA reports, this East Antarctic Ice Shelf produced an immense 20 kilometer long iceberg. A towering block of ice covering an area larger than Manhattan floating on out toward the world’s shipping lanes.

Nansen Ice Shelf in the East End of East Antarctica.
(Image source. ESA via Robertscribbler.)
Surface melt water flooding into a great crack along the Nansen Ice Shelf. Large volumes of melt water flooding into ice shelf cracks forces them to widen even as they dive toward union with the warming waters below.

The Nansen Ice Shelf, before this most recent very large iceberg calving event, was a 10 mile wide and 30 mile long ice shelf that buttressed the Presley and Reeve Glaciers of East Antarctica. It abuts the north side of the Drygalski Ice Tongue, and runs out from Mount Nansen just inland of the coast of Victoria Land, Antarctica. And it’s yet another large shelf of ice that appears to be facing severe weakening as global average temperatures are driven above 1 C warmer than those experienced during the late 19th Century by an ongoing and reckless fossil fuel emission.

Nansen occupies a region of the world that has come under increasingly intense observation due to a number of scientific studies highlighting its accelerating rates of melt and a related risk of rapidly rising global sea levels.  Human-forced heating of the world’s ocean has caused waters warm enough to accelerate glacial melt to encroach upon Antarctica from the Southern Ocean. These warmer waters are drawn along beneath the floating ice shelves as fresh melt water flooding out along the ocean surface generates a landward-moving bottom current. These warmer waters eventually push beneath the ice shelves — eating away at their undersides.
And here is a map of Antarctica to show you exactly where the Nansen Ice Shelf is:

Image source: Science, via Robertscribbler.)
Though the most rapid rates of glacial melt dominate the Antarctic Peninsula and the region near the Pine Island and Thwaites glaciers, increasing rates of volume loss from Antarctic ice shelves have been creeping into a section of East Antarctica near the Nansen Ice Shelf along the coastline of the Ross Sea [just below where the abbreviation DRY for Drygalski Ice Tongue appears on the map]. With global average temperatures now exceeding 1 C above pre-industrial, we can expect melt and net volume loss to expand along the Antarctic coastline.
And here an enlargement of the above map showing the East End of East Antarctica where the Nansen Ice Shelf is, just to the north of the DRY [Drygalski Ice Tongue]:


What makes matter worse, is that the under-the-ice slopes of Antarctica are in retrograde; that is, the ice gets deeper the more inland you go. So the warmer waters underneath gets to melt more ice as they advance under the ice shelves and glaiciers, making them all the more unstable, so that huge pieces will break off and float away, as in this spectacular gif that I won't post in this article, you have to go to Robertscribbler to go see it, here.

Saturday, April 23, 2016

Weird Weeather Coming in at a Torrent as Global Weriding from AGW Goes on Steroids

Yeah… all this is increasingly strange and coming in at a torrent, too. I can’t even keep up, now!

From Robert Scribbler, 22 April 2016:😦

Record Global Heat — Huge Springtime Arctic Warm-up to Crush Sea Ice, Drive Extreme Jet Stream Dip into Europe

We know now, as soon as the middle of April, that 2016 will be the hottest year on record. That not only will it be the hottest year, but that it will crush any other previous record hot year by a wide margin.

NASA GISS head — Gavin Schmidt — in a recent tweet estimated that 2016 would fall into a range near 1.32 C above the 1880-1899 average that NASA uses for its preindustrial baseline. By comparison, 2015 — which was the most recent hottest year on record after 2014 (three in a row!) — hit 1.07 C above the 1880-1899 average.

As a result, 2016 will likely have jumped by about a quarter of a degree Celsius in a single year. If every year from 2016 on warmed up so fast the world would surpass the dreaded 2 C mark by 2019 and rocket to about +22 C above 19th Century averages by 2100. That’s not going to happen. Why? Because natural variability assisted greenhouse gas warming from fossil fuels to kick 2016 higher in the form of a serious heavyweight El Nino. But it’s a decent exercise to show how ridiculously fast the world is expected to warm from 2015 to 2016. And in the 2014-2016 string of three record warm years in a row we are basically expecting a 0.40 C jump above the then record warm year of 2010. Given that the world has warmed, on average by about 0.15 C to 0.20 C per decade since the late 1970s, what we’re expecting to see is about two decades worth of warming all cram-jammed into the past three years.

More Severe Arctic Heat is on the Way

But the Earth, as of this Earth Day, hasn’t warmed evenly. A far, far greater portion of that excess heat has stooped over the Arctic. During the first three months of 2016, the Arctic region above 66 degrees North Latitude has been fully 4.5 C hotter than the NASA 20th Century baseline. That’s a departure more than three times that of the rest of the Earth. And that’s bad news for anyone concerned about sea ice, or polar bears, or Arctic carbon feedbacks, or predictable seasons, or extreme droughts and floods, or the Jet Stream, or Greenland melt, or sea level rise, or … well, you get the picture.

Shattered sea ice over the Beaufort and Chukchi sea.
MacKenzie Delta, Yukon on lower left. Image source: LANCE MODIS.
A final warm wind event will be fed by a big warm up across Alaska predicted to settle in on Wednesday and Thursday. There, temperatures in Central Alaska are expected to rise into the lower 60s as two stalled out lows to the south pull warmer airs up from the Pacific Ocean. This heat is expected to invade the Chukchi and Beaufort seas driving temperatures to near or above freezing over Arctic Ocean surfaces that have already witnessed a great shattering of ice and an opening of dark, heat-venting open water holes. There the anomaly spike will be slightly milder — in the range of 15-32 F (8-18 C) above average. Such heat will provide melt stress to the fractured Beaufort, likely making more permanent the wide array of open water and thin ice spaces as the push toward Summer advances.

Mangled Jet Stream to Bring Storms to Europe

As all this heat bullies its way into the Arctic, a flood of cold air is expected to flee out of the region and on down a big dip in the Jet Stream — making a late-season invasion across the North Atlantic and into Europe. There, as we’ve seen previously during recent warm wind invasions of the Arctic during Fall, Winter and Spring, warm air from the south tends to cause cold to break out and then to dive down the trough lines. And there’s a huge trough predicted to dig in over Europe.

A very deep Arctic trough is expected to dig into Europe and the Mediterranean this coming week bringing with it the likelihood of some very severe weather. Image source: ECMWF/Severe Weather EU.

More including over a hundred excellent and informative comments here: https://robertscribbler.com/2016/04/22/record-global-heat-huge-springtime-arctic-warm-up-to-crush-sea-ice-drive-extreme-jet-stream-dip-into-europe/#comment-76118

Two new vids...


From April 21st
 

And April 22nd.


2016 is strange.

Enjoy!

Tuesday, April 19, 2016

2016 IS STRANGE part 10 // APRIL

Here's the latest from LAST MESSAGES. THe flooding we had in Houston yesterday isn't there, but it'll show up in Part 11.


Enjoy.

2016 is strange!

Saturday, April 16, 2016

The Universe Knows!

A compilation of the strangeness of our atmosphere in the past few years, especially UFOs. Don't know what they are, but the most likely source is our military-industrial complex. After that, inanimate celestial objects, etc. Swamp gas (methane = CH4) cannot be the "explanation" for UFOs these days, but it is a good explanation for some of these weird noctilucent clouds, sometimes on the surface, that have a strange puke yellow or puke green glow that is brightest at the center and fades from center out.


And here's a vid I made last night. Posted under my YouTube pseudonym, PfctvsPontivsPilatvs.


2016 is strange!

Friday, April 15, 2016

Greenland Ice Melt Season Has Begun.

It takes ten percent of Greenland's Ice Cap surface to melt for its summer melt season  to begin. Usually around when May turns to June but this year it has already begun, on April 11th.

THis is weird. It's about a couple of months early for the melt season to begin, but here we are. The ice has not begun to melt in this matter this early, probably ever since the Eemian Period, an interglacial which came to an end with global superstorms, according to Dr. James Hansen and evidence dug up by a legion of paleoclimate scientists.

The Greenland Summer Melt Season Just Started in April

by Robertscribbler 12 April 2016

12 Percent. That’s how much of Greenland’s surface experienced melt yesterday according to a report from DMI’s Polar Portal  as an unprecedented flow of warm, wet air slammed into its great ice sheets. 10 Percent. That’s how much of Greenland’s ice sheet surface is required to melt in order to mark an official start to the Summer melt season. Late May or early June. That’s when Greenland melt season typically begins.

In other words, a Greenland melt season that usually starts as May rolls into June and has never initiated before May 5th just began on April 11th of 2016. That’s 24 days ahead of the previous record set only six years ago and more than a month and a half ahead of the typical melt start. In other words — way too early. But in a rapidly heating world where monthly temperatures have now exceeded a range of 1.5 C above 1880s levels, we could well expect Greenland melts to begin earlier, end later, and encompass more and more of the ice sheet surface at peak melt during July.


Record Early Start to Greenland Melt Season
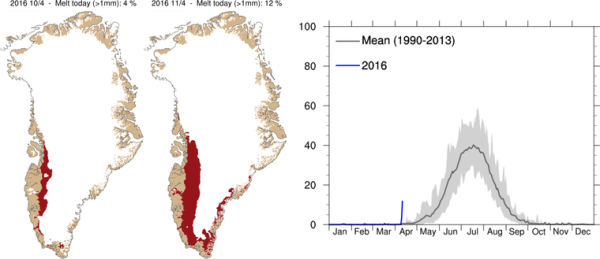
(Record early start to Greenland’s ‘Summer’ melt season occurred on April 11, 2016 according to reports from DMI’s Polar Portal.)

Yesterday’s new record early melt start occurred as extraordinarily warm temperatures in the range of 20-40 degrees Fahrenheit above average swept over southern, central and western Greenland. This flood of extremely warm temperatures for Greenland was accompanied by heavy rains and strong winds — gusting to gale or even hurricane force in some locations. In some areas, rain fell over the ice sheet itself. As recently as midday Tuesday, Dr. Jason Box — a prominent Greenland researcher — tweeted a report from a friend in Nuuk that the city was “close to drowning in water caused by rain and snow melt.”

Close to drowning in water from the rain and snow-melt. Sounds like parts of Louisiana which flooded this past March, especially western Saint Tammany Parish, which almost drowned from the historic flash floods there. So it looks like Nuuk is having flash floods from this North Atlantic gale that's melting a lot of snow and ice with its extraordinary amount of rain.

Raúl Ilargi Meijer of The Automatic Earth says the above graphic is the "Scary graph of the day."

Greenland’s Melt Season Started Nearly Two Months Early (CC)
Brian Kahn, Climate Central. 12 April 2016
To say the 2016 Greenland melt season is off to the races is an understatement. Warm, wet conditions rapidly kicked off the melt season this weekend, more than a month-and-a-half ahead of schedule. It has easily set a record for earliest melt season onset, and marks the first time it’s begun in April. Little to no melt through winter is the norm as sub-zero temperatures keep Greenland’s massive ice sheet, well, on ice. Warm weather usually kicks off the melt season in late May or early June, but this year is a bit different. Record warm temperatures coupled with heavy rain mostly sparked 12% of the ice sheet to go into meltdown mode. Almost all the melt is currently centered around southwest Greenland.
....

According to Polar Portal, which monitors all things ice-related in the Arctic, melt season kicks off when 10% of the ice sheet experiences surface melt. The previous record for earliest start was May 5, 2010. This April kickoff is so bizarrely early, scientists who study the ice sheet checked their analysis to make sure something wasn’t amiss before making the announcement. “We had to check that our models were still working properly” Peter Langen, a climate scientist at the Denmark Meteorological Institute (DMI), told the Polar Portal. But alas, the models are definitely working and weather data and stories coming out of West Greenland have borne that out. According to DMI, temperatures at Kangerlussuaq, a small village in southwest Greenland, set an April record for that location when they reached 64.4°F (17.8°C) on Monday. That’s just a scant .4°F (.2°C) off the all-time Greenland high for April. Heavy rain have also inundated local communities.
And that's not the scariest graph! One of the commenters at The Automatic Earth, Nassim, yesterday found an even scarier graph! One that shows a lot of basal melt under the central region and north side of Greenland's ice cap:

http://joannenova.com.au/2016/04/hot-magma-is-melting-greenland-ice-can-windfarms-save-it/

And he left this comment:

About Greenland and that “scary graph”, here is an alternative explanation:

“Ice-penetrating radar and ice core drilling have shown that large parts of the north-central Greenland ice sheet are melting from below. It has been argued that basal ice melt is due to the anomalously high geothermal flux that has also influenced the development of the longest ice stream in Greenland. Here we estimate the geothermal flux beneath the Greenland ice sheet and identify a 1,200-km-long and 400-km-wide geothermal anomaly beneath the thick ice cover. We suggest that this anomaly explains the observed melting of the ice sheet’s base, which drives the vigorous subglacial hydrology3 and controls the position of the head of the enigmatic 750-km-long northeastern Greenland ice stream. Our combined analysis of independent seismic, gravity and tectonic data implies that the geothermal anomaly, which crosses Greenland from west to east, was formed by Greenland’s passage over the Iceland mantle plume between roughly 80 and 35 million years ago. We conclude that the complexity of the present-day subglacial hydrology and dynamic features of the north-central Greenland ice sheet originated in tectonic events that pre-date the onset of glaciation in Greenland by many tens of millions of years.”
Well what's causing all that magma flow? Could it be that it's being drawn in by the seismic uplift of the island due to loss of solid ice mass ALREADY!?! We do know there has been seismic activity around the island in recent years. Or is the ice-melt from below mainly due to the incoming water from the moulins bleus introduced by surface melt during the summer months? Or a combination of the two? Inquiring minds want to know. I'll refer this to Robertscribbler.


Latest from LAST MESSAGES.

2016 IS STRANGE Part 9 // April


2016 is strange!

Enjoy.

Thursday, April 14, 2016

More Weird Weather -- from Angel Of Apocalypse on You Tube.

No, I don't endorse the End Of Times Christian orientation of the video, but it's an excellent log of our weird weather due to Global Warming.


2016 is strange. Enjoy!

Monday, April 11, 2016

Mystery Finger Clouds

Snapshot taken Saturday, April 9, 2016 to the east of Broadmoor, New Orleans, La., at sunset, 7:14 PM.


2016 is strange!

Saturday, April 2, 2016

LAST MESSAGE's 2016 IS STRANGE Part 8 // MARCH

Here it is!


2016 is strange.

WIcked Thunderstorm Yesterday

We had a wicked intense thunderstorm yesterday here in New Orleans. Over 6" of rain measured in the Lake Vista neighborhood, which is up on the Lake (Pontchartrain). After the storms went through the wind picked up out of the northeast and it was COLD! And the air smelled like it does in Winter, too, when there's a northerly wind. Plus, the clouds were all weird. The lone photo can't do the strangeness justice.


Mind you, this is late spring for New Orleans.

2016 is strange.