Showing posts with label Greenland. Show all posts

Wednesday, June 22, 2016

More Global Weirding

Local Reports Reveal Heat Index of 170 F (77 C) in India on 13th of June, 2016.


And this graphic was just for May! Back-to-back record heat two months in a row.
Image source: Skymetweather


Arctic Ice on Path to Matching Record Low as Ice Pulls Away from Greenland because of Jet-Stream-Imported Heat.


Ice pulling away from Greenland North Shore. Bottom of Frame distance is 400 miles.
Image source: LANCE MODIS.
Western Heat Dome Makes Wildfires Get Wicked Big, Act Wicked Strange and Burn Wicked Bad.


Cedar Creek Fire grows in size as it changes direction late Sunday. Image source: Chris Gross.


Thursday, May 5, 2016

Southern Louisiana faces existential threat from Global Warming.

Reported in The New Orleans Advocate, Sunday, 1 May, 2016.


Sheets of Runoff fall off the Nansen Ice Shelf in the East End of East Antarctica.
According to Sunday's article, coastal researchers Donald Boesch and Virginia Burkett, known for their expertise on reasons why the state’s coast is being flooded by the Gulf, present new findings on why Global Warming is the key to whether Southern Louisiana can be saved or not. Their findings reveal that humanity, individually and collectively, must "[k]eep global temperatures from rising more than 2 degrees Celsius (3.6 degrees Fahrenheit) by 2100, and little will change in Antarctica, which means sea-level rise could be manageable and Louisiana’s coastal plan might succeed." Ditto for Greenland.

According to the following Advocate Graphic, keeping to the 2016 COP21 Paris Accords' goal of keeping below 2 degrees Celsius would limit sea level rise to one foot above today's level at the end of this Century. With Business As Usual, the SLR will reach 6 feet globally. When you factor in Peak Oil / Natural Gas / Coal and the coming decline in fossil fuel outputs into BAU, we'll likely see somewhere in between -- unless Greenland and West Antarctica collapse rapidly, then we'll get 42 feet of SLR in a short period of time. This could actually happen! At the end of the last Ice-Age, ice melt from Antarctica led to 14½ meters of SLR per Century for about a thousand years. Total SLR then was 400 feet.


If we fail the COP21 goal, "and the result could be a sudden, dramatic melting of ice on Antarctica, adding another 3 feet to the current prediction of a 3.5-foot rise in sea level by 2100 — an event that would swamp most of the southern third of Louisiana, even if the master plan is implemented."

Here is what 6 feet of SLR in Southern Louisiana looks like. Just 1 foot looks almost as bad.


The Advocate reports, and it's basically true except for the West Antarctic which is melting like Greenland, that:
Antarctica has been melting at a drip. Indeed, the melting of the ice fields of Greenland — on the northern end of the planet — has been much faster. Located in a warmer environment, those ice fields and glaciers have been pouring water into the Arctic Ocean at rates alarming climatologists. Computer models show sea levels would rise almost 20 feet if all the ice in Greenland melts.

If all the ice in Antarctica melts, those same models show the oceans would rise 200 feet, meaning Baton Rouge would be on the coast.
But there are two monkey wrenches hidden in the Advocate's article, and one is the fact that East Antarctica is beginning to melt like Greenland did less than a decade ago. The other is the effect of gravity on the sloshing sea water in the coming Global Warming induced SLR. What is gravity's effect on sea-level rise in Southern Louisiana?

From the article (boldface emphasis mine):
Any rise would be even higher on the Louisiana coast because this area would have an increasingly strong gravitational pull as Antarctica lost all that ice, Boesch said.

“So if a certain amount of ice melts and raises global sea level by 1 centimeter, in Louisiana, that rise would be 1.2 or 2.5 centimeters,” he said. “Just another reason why we (in Louisiana) have to be really concerned about these sea-level rise figures.”
So at the maximum translation 1 foot of global sea level rise is 2½ feet, 20 feet of G-SLR is 50 feet, 200 feet, 500 feet. That's a lot of water. At just 12 or 13 feet, with our 32-foot barrier walls and seaward embankments, New Orleans will certainly drown. And Baton Rouge and the rest of the state?

The elevation of Baton Rouge is 83 feet above mean sea level. The elevation of Shreveport, 209 feet above MSL. And the highest point in the state, 535 feet.

Ohhhhh, shit.
 

Friday, April 15, 2016

Greenland Ice Melt Season Has Begun.

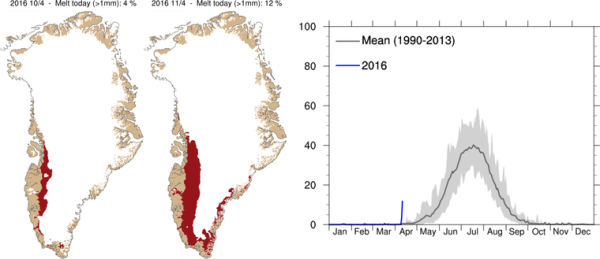
It takes ten percent of Greenland's Ice Cap surface to melt for its summer melt season  to begin. Usually around when May turns to June but this year it has already begun, on April 11th.

THis is weird. It's about a couple of months early for the melt season to begin, but here we are. The ice has not begun to melt in this matter this early, probably ever since the Eemian Period, an interglacial which came to an end with global superstorms, according to Dr. James Hansen and evidence dug up by a legion of paleoclimate scientists.

The Greenland Summer Melt Season Just Started in April

by Robertscribbler 12 April 2016

12 Percent. That’s how much of Greenland’s surface experienced melt yesterday according to a report from DMI’s Polar Portal  as an unprecedented flow of warm, wet air slammed into its great ice sheets. 10 Percent. That’s how much of Greenland’s ice sheet surface is required to melt in order to mark an official start to the Summer melt season. Late May or early June. That’s when Greenland melt season typically begins.

In other words, a Greenland melt season that usually starts as May rolls into June and has never initiated before May 5th just began on April 11th of 2016. That’s 24 days ahead of the previous record set only six years ago and more than a month and a half ahead of the typical melt start. In other words — way too early. But in a rapidly heating world where monthly temperatures have now exceeded a range of 1.5 C above 1880s levels, we could well expect Greenland melts to begin earlier, end later, and encompass more and more of the ice sheet surface at peak melt during July.


Record Early Start to Greenland Melt Season
(Record early start to Greenland’s ‘Summer’ melt season occurred on April 11, 2016 according to reports from DMI’s Polar Portal.)

Yesterday’s new record early melt start occurred as extraordinarily warm temperatures in the range of 20-40 degrees Fahrenheit above average swept over southern, central and western Greenland. This flood of extremely warm temperatures for Greenland was accompanied by heavy rains and strong winds — gusting to gale or even hurricane force in some locations. In some areas, rain fell over the ice sheet itself. As recently as midday Tuesday, Dr. Jason Box — a prominent Greenland researcher — tweeted a report from a friend in Nuuk that the city was “close to drowning in water caused by rain and snow melt.”

Close to drowning in water from the rain and snow-melt. Sounds like parts of Louisiana which flooded this past March, especially western Saint Tammany Parish, which almost drowned from the historic flash floods there. So it looks like Nuuk is having flash floods from this North Atlantic gale that's melting a lot of snow and ice with its extraordinary amount of rain.

Raúl Ilargi Meijer of The Automatic Earth says the above graphic is the "Scary graph of the day."

Greenland’s Melt Season Started Nearly Two Months Early (CC)
Brian Kahn, Climate Central. 12 April 2016
To say the 2016 Greenland melt season is off to the races is an understatement. Warm, wet conditions rapidly kicked off the melt season this weekend, more than a month-and-a-half ahead of schedule. It has easily set a record for earliest melt season onset, and marks the first time it’s begun in April. Little to no melt through winter is the norm as sub-zero temperatures keep Greenland’s massive ice sheet, well, on ice. Warm weather usually kicks off the melt season in late May or early June, but this year is a bit different. Record warm temperatures coupled with heavy rain mostly sparked 12% of the ice sheet to go into meltdown mode. Almost all the melt is currently centered around southwest Greenland.
....

According to Polar Portal, which monitors all things ice-related in the Arctic, melt season kicks off when 10% of the ice sheet experiences surface melt. The previous record for earliest start was May 5, 2010. This April kickoff is so bizarrely early, scientists who study the ice sheet checked their analysis to make sure something wasn’t amiss before making the announcement. “We had to check that our models were still working properly” Peter Langen, a climate scientist at the Denmark Meteorological Institute (DMI), told the Polar Portal. But alas, the models are definitely working and weather data and stories coming out of West Greenland have borne that out. According to DMI, temperatures at Kangerlussuaq, a small village in southwest Greenland, set an April record for that location when they reached 64.4°F (17.8°C) on Monday. That’s just a scant .4°F (.2°C) off the all-time Greenland high for April. Heavy rain have also inundated local communities.
And that's not the scariest graph! One of the commenters at The Automatic Earth, Nassim, yesterday found an even scarier graph! One that shows a lot of basal melt under the central region and north side of Greenland's ice cap:

http://joannenova.com.au/2016/04/hot-magma-is-melting-greenland-ice-can-windfarms-save-it/

And he left this comment:

About Greenland and that “scary graph”, here is an alternative explanation:

“Ice-penetrating radar and ice core drilling have shown that large parts of the north-central Greenland ice sheet are melting from below. It has been argued that basal ice melt is due to the anomalously high geothermal flux that has also influenced the development of the longest ice stream in Greenland. Here we estimate the geothermal flux beneath the Greenland ice sheet and identify a 1,200-km-long and 400-km-wide geothermal anomaly beneath the thick ice cover. We suggest that this anomaly explains the observed melting of the ice sheet’s base, which drives the vigorous subglacial hydrology3 and controls the position of the head of the enigmatic 750-km-long northeastern Greenland ice stream. Our combined analysis of independent seismic, gravity and tectonic data implies that the geothermal anomaly, which crosses Greenland from west to east, was formed by Greenland’s passage over the Iceland mantle plume between roughly 80 and 35 million years ago. We conclude that the complexity of the present-day subglacial hydrology and dynamic features of the north-central Greenland ice sheet originated in tectonic events that pre-date the onset of glaciation in Greenland by many tens of millions of years.”
Well what's causing all that magma flow? Could it be that it's being drawn in by the seismic uplift of the island due to loss of solid ice mass ALREADY!?! We do know there has been seismic activity around the island in recent years. Or is the ice-melt from below mainly due to the incoming water from the moulins bleus introduced by surface melt during the summer months? Or a combination of the two? Inquiring minds want to know. I'll refer this to Robertscribbler.